


Bank Nifty Analysis for 30 March 2026
In this blog, we will understand the Bank Nifty market using three timeframes — Daily, 4 Hour, and 1 Hour. This simple analysis will help traders understand the trend and what can happen on 30 March 2026.
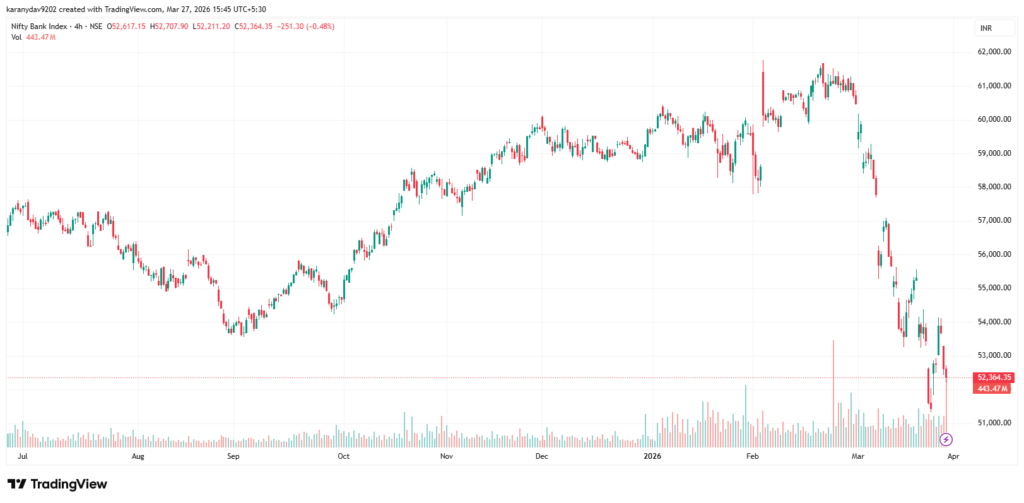
Daily Timeframe Analysis (1D)
On the daily chart, the market is clearly in a downtrend. Bank Nifty is making lower highs and lower lows. This shows that sellers are strong.
The market has fallen from higher levels near 61,000 to around 52,000. Even though there is a small bounce, there is no strong buying visible.
This means the trend is still bearish.
Conclusion: Trend is DOWN
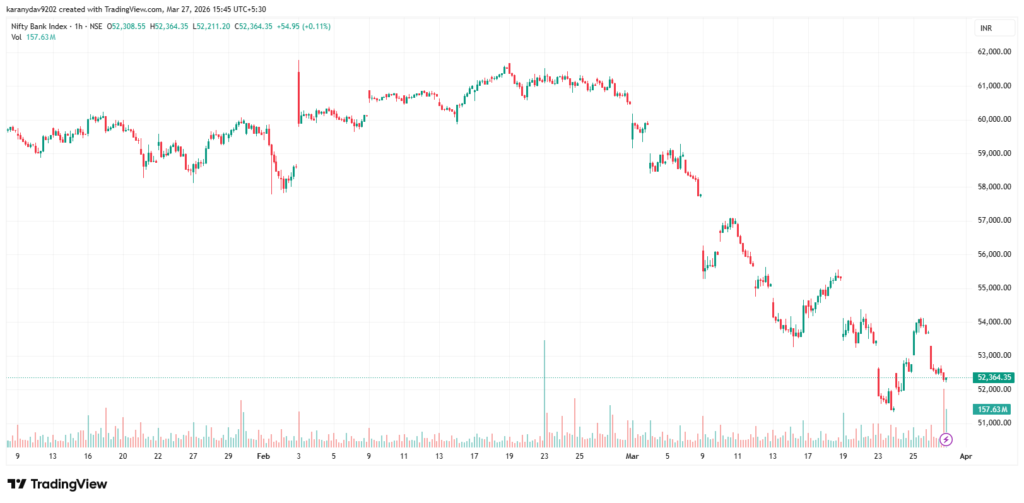
4 Hour Timeframe Analysis (4H)
On the 4-hour chart, we can see that whenever the market goes up, it faces rejection.
Price is not able to break resistance levels. Selling pressure is coming again and again.
Also, the fall is fast but the rise is slow. This shows weakness in the market.
Conclusion: Sell on rise
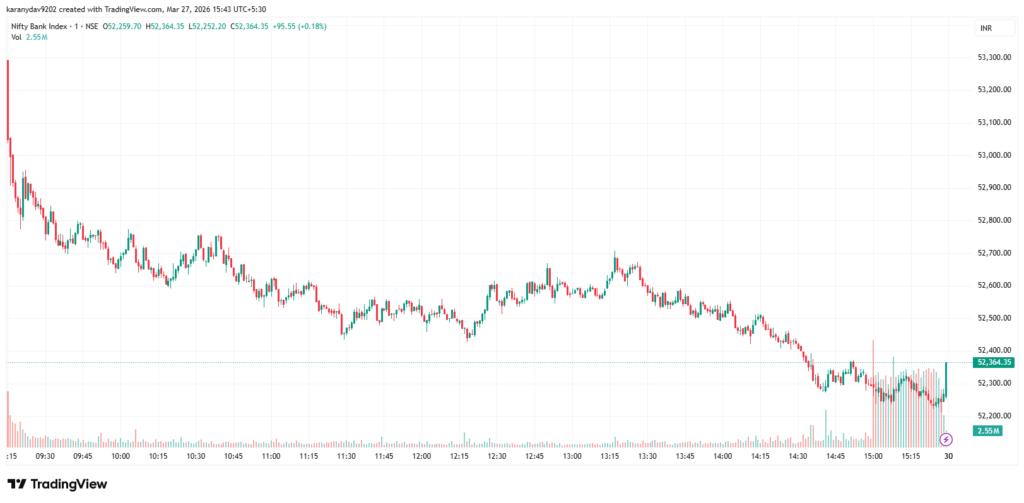
1 Hour Timeframe Analysis (1H)
On the 1-hour chart, the market is showing a small bounce from support.
But this bounce is weak. Price is not making higher highs. Buyers are not strong.
This move looks like a pullback, not a reversal.
Conclusion: Weak bounce
Key Levels for 30 March
Support:
52,000
51,500
Resistance:
52,800 – 53,200
53,800
These levels are very important for trading.
Trading Strategy
Right now, all timeframes are showing weakness.
Daily → Downtrend
4H → Selling pressure
1H → Weak bounce
Best strategy is Sell on rise
Trade Setup
- Sell near: 52,800 – 53,200
- Stop Loss: Above 53,500
- Target: 52,000 → 51,500
Avoid buying unless the market breaks resistance strongly.
Final Market View
The Nifty 50 market is still weak. There is no strong sign of reversal.
Traders should stay careful and follow the trend.
Final: Trend is down, focus on selling