

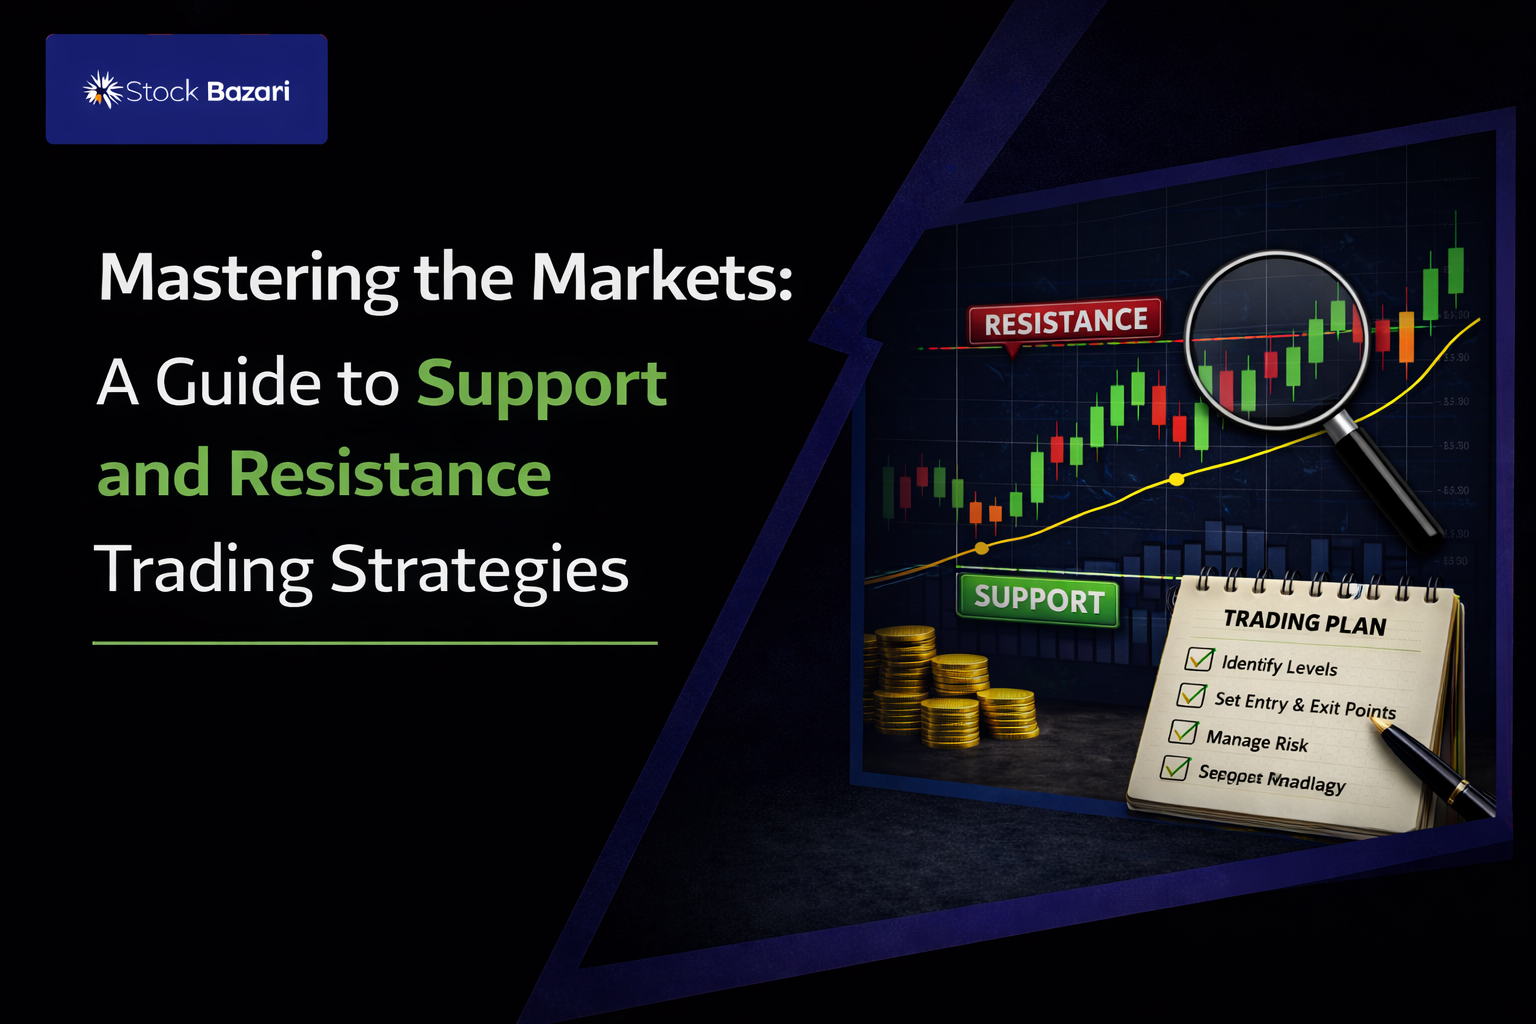
The Market’s Hidden Floor and Ceiling
Every trader eventually hits a wall where they can spot a great entry but have no idea when to exit. You’ve mastered the candlestick patterns and you know exactly where to put your stop-loss, but the “exit” remains a guessing game. To trade like a professional, you need to understand the structural “floor” and “ceiling” of the market.
By utilizing support and resistance indicators, you can transform a simple observation into a fully realized trading plan with clear price targets.
What are Support and Resistance?
In the world of trading, price doesn’t move in a straight line. It bounces between specific zones of high supply and high demand.
The Resistance (The Ceiling)
Resistance is a price level where a rising stock hits a “ceiling.” At this point, traders expect a maximum supply of shares to hit the market. In other words, there are more sellers than buyers.
Because resistance sits above the current market price, it acts as a natural barrier. If you are in a “long” trade, the resistance level is your ideal target. Why? Because history shows that when the price reaches this zone, selling pressure usually drags it back down.
The Support (The Floor)
Support is the exact opposite—it is the “floor” that prevents a stock from falling further. This is a price point where demand is expected to surge as buyers outnumber sellers.
Whenever a stock dips to a support line, it has a high likelihood of “bouncing” back up. If you are “shorting” a stock, the support level is your logical profit target. It represents the point where buying pressure will likely kick in and push the price against your position.
4 Steps to Identifying Support and Resistance Indicators
Building a strategy around these levels is a systematic process. Here is how you can identify and draw them on any chart:
1. Load Sufficient Data
To find reliable levels, you need perspective. For short-term or intraday trades, look at 3–6 months of data. For long-term swing trades, load 12–18 months. Compressing the chart helps the major “sticky” points stand out.
2. Spot Price Action Zones
Look for areas on the chart where the price behaved peculiarly:
- Hesitation: Where the price struggled to move higher or lower.
- Reversals: Points where the trend suddenly flipped.
- Stickiness: Levels where the price seemed to hover for several days.
3. Align and Space the Zones
The best support and resistance indicators are those that have been tested multiple times. Look for at least three price action zones that align horizontally. These points should be well-spaced in time (weeks or months apart) to prove that the level is historically significant.
4. Draw the Zone
Connect these points with a horizontal line. Remember, technical analysis is an art of approximation. Instead of looking for a single “magic number,” treat these lines as zones or ranges. Adding a few points of “buffer” on either side of your line helps account for market noise.
The Ultimate Trading Checklist
The secret to high-probability trading is confluence—the meeting of two or more technical signals. Don’t just trade a support line in isolation. Instead, wait for a candlestick pattern to form at that support level.
Your Execution Framework:
- Candlestick Pattern: Does the stock show a clear signal (like a Bullish Marubuzo)?
- S&R Confirmation: Is the pattern low (for longs) or pattern high (for shorts) sitting right on a support or resistance zone?
By following this disciplined approach, you ensure that you aren’t just chasing prices, but trading at levels where the “big money” is likely to step in.