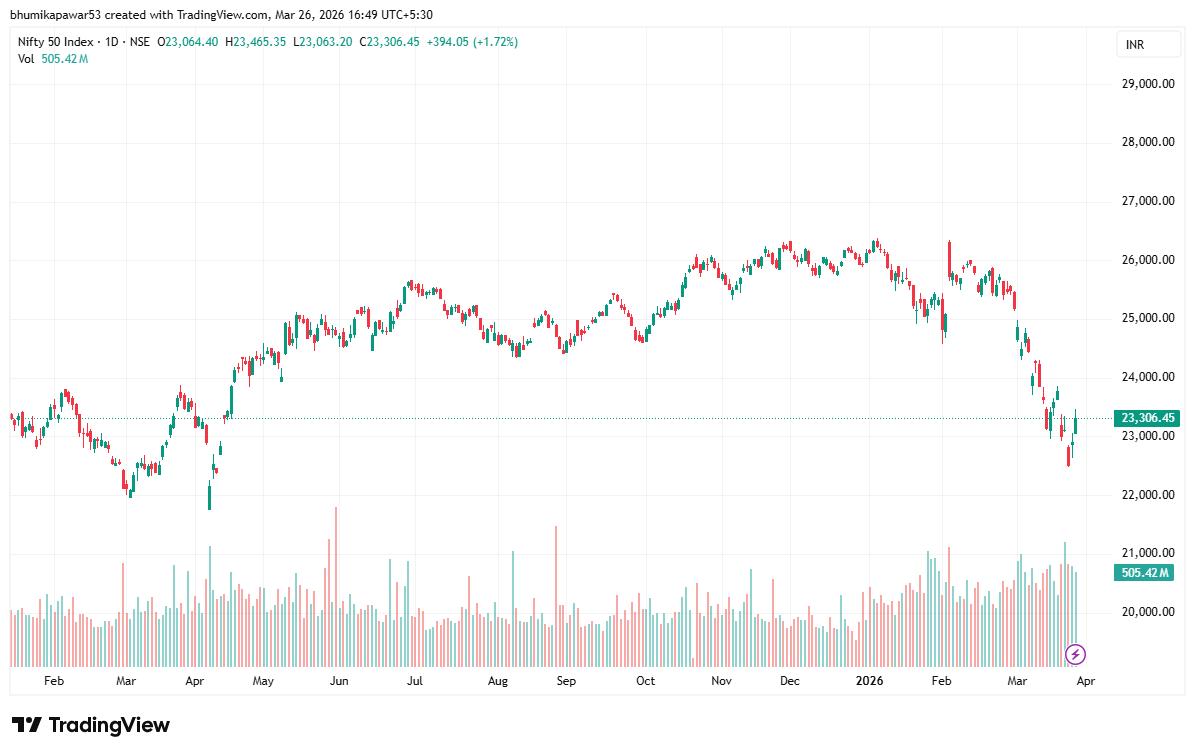


Nifty 50 Prediction for 27 March 2026: Sell on Rise Strategy in Focus The Indian stock market ended the session on a volatile note, with..
by
Read Time

Previous Post
Next Post
“StockBazaari”, Where Your Trading Behavior Becomes Your Strategy Most stock research firms follow an outdated, one-size-fits-all model, where every client receives the same generic buy/sell recommendations. But we believe that every trader is unique, and their research should be tailored accordingly.
Beginner Guide Blog Corporate Actions Daily Market Analysis Debt-Free Companies IPO Tracker Market Events Personal Finance Stock Market Basics Trading Psychology Trading Strategies
Bank Nifty bonus shares corporate actions Crude Oil debt free companies financial analysis Global Economy Global Markets Indian Economy Intraday Trading Investing Basics Investing Guide Investor Strategy IPO analysis IPO guide IPO investing IPO investment IPO strategy IPO tips IPO tracker Long Term Investing market analysis Market Crash Market Events Nifty 50 Nifty Analysis Nifty Levels Nifty Prediction Nifty Trading Oil Prices Options Trading Option Trading Price Action Risk Management stock investing Stock Market Stock Market Basics Stock Market Crash Stock Market India stock market news stock split Technical Analysis Trading Strategies Trading Strategy zero debt stocks
Access over the years of investigative journalism and breaking reports