

Technical Analysis in the Stock Market
Many traders in the Indian stock market rely on technical analysis to make trading decisions.Instead of focusing on company financial statements, technical analysis studies price movements and chart patterns.
The goal is to understand how the market behaves and predict possible future price movements.
For beginners, learning technical analysis is an important step toward becoming a better trader.
What is Technical Analysis?
Technical analysis is a method used to analyze stocks by studying price charts, patterns, and market trends.
Traders believe that historical price movements can help predict future price behavior.
Technical analysis focuses on three main principles:
- Market prices reflect all available information
- Price movements follow trends
- History tends to repeat itself in the market
By studying these trends, traders try to identify the best time to buy or sell a stock.
Why Technical Analysis is Important for Traders
Technical analysis is widely used by traders for several reasons.
First, it helps traders identify market trends.
Second, it allows traders to find entry and exit points for trades.
Third, it helps manage risk by identifying important price levels.
For example, many intraday traders in India use technical analysis to analyze stocks and indices such as Nifty or Bank Nifty before placing trades.
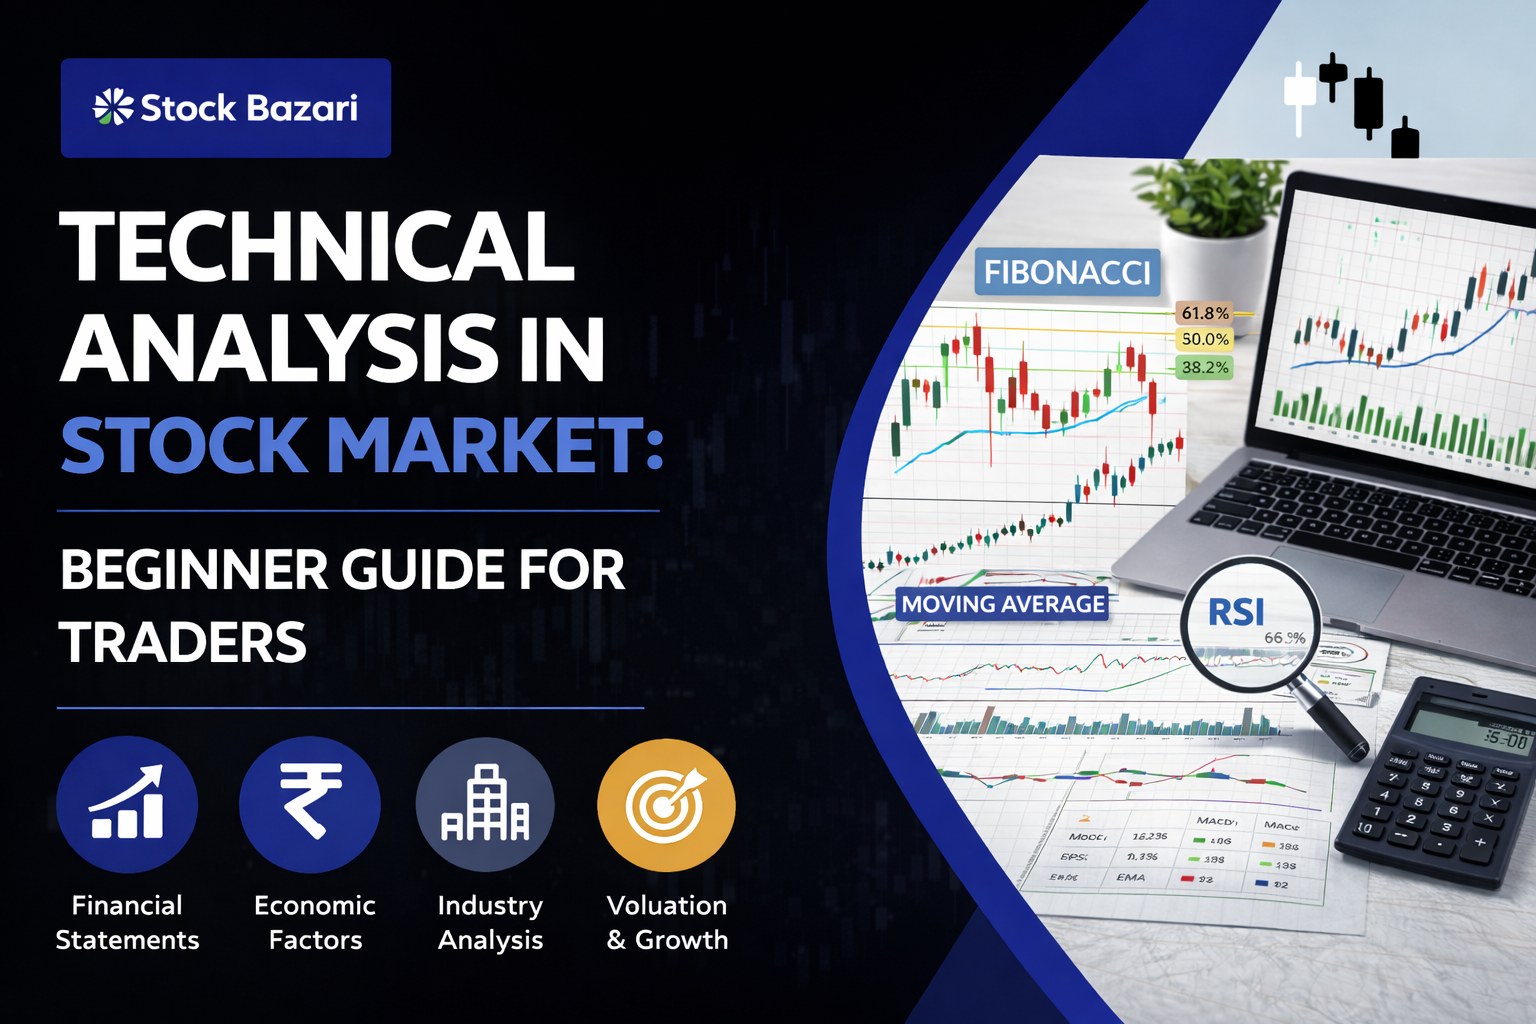
Basic Tools Used in Technical Analysis
There are many tools used in technical analysis, but beginners usually start with a few basic ones.
Stock Charts
Stock charts show the price movement of a stock over time.
The most common types of charts include:
- Line charts
- Bar charts
- Candlestick charts
Candlestick charts are widely used because they show detailed price information such as opening price, closing price, high, and low.
Support and Resistance
Support and resistance are important concepts in technical analysis.
Support is a price level where the stock usually stops falling and may start rising.
Resistance is a price level where the stock may stop rising and start falling.
Traders use these levels to decide when to enter or exit trades.
Technical Indicators
Technical indicators are mathematical calculations based on price and volume.
Some commonly used indicators include:
- Moving Average
- Relative Strength Index (RSI)
- MACD
- Bollinger Bands
These indicators help traders understand market momentum and possible trend changes.
Example of Technical Analysis
Let’s look at a simple example.
Suppose a stock has been rising for several days and reaches a resistance level
Technical analysis may suggest that the price could slow down or reverse from that level.
Traders may decide to sell or wait for a breakout above resistance before entering a trade.
This type of analysis helps traders make more informed decisions.
Technical Analysis vs Fundamental Analysis
Technical analysis and fundamental analysis are two different approaches used in the stock market.
Technical analysis focuses on price charts and market patterns.
Fundamental analysis focuses on company financials, earnings, and economic factors.
Short-term traders usually prefer technical analysis, while long-term investors often rely on fundamental analysis.
Both methods can be useful depending on the trading strategy.
Tips for Beginners Learning Technical Analysis
If you are new to technical analysis, start with simple concepts before moving to advanced strategies.
Follow these tips:
- Learn basic chart patterns
- Practice identifying support and resistance
- Use only a few indicators at first
- Avoid overanalyzing charts
- Keep learning and practicing regularly
Technical analysis improves with experience and consistent practice.
Conclusion
Technical analysis is an important tool used by traders to analyze stock price movements and identify trading opportunities.
By studying charts, patterns, and indicators, traders try to understand market trends and make better trading decisions.
For beginners in the Indian stock market, learning technical analysis can significantly improve trading skills and confidence.
With patience, practice, and discipline, technical analysis can become a powerful part of a trader’s strategy.