

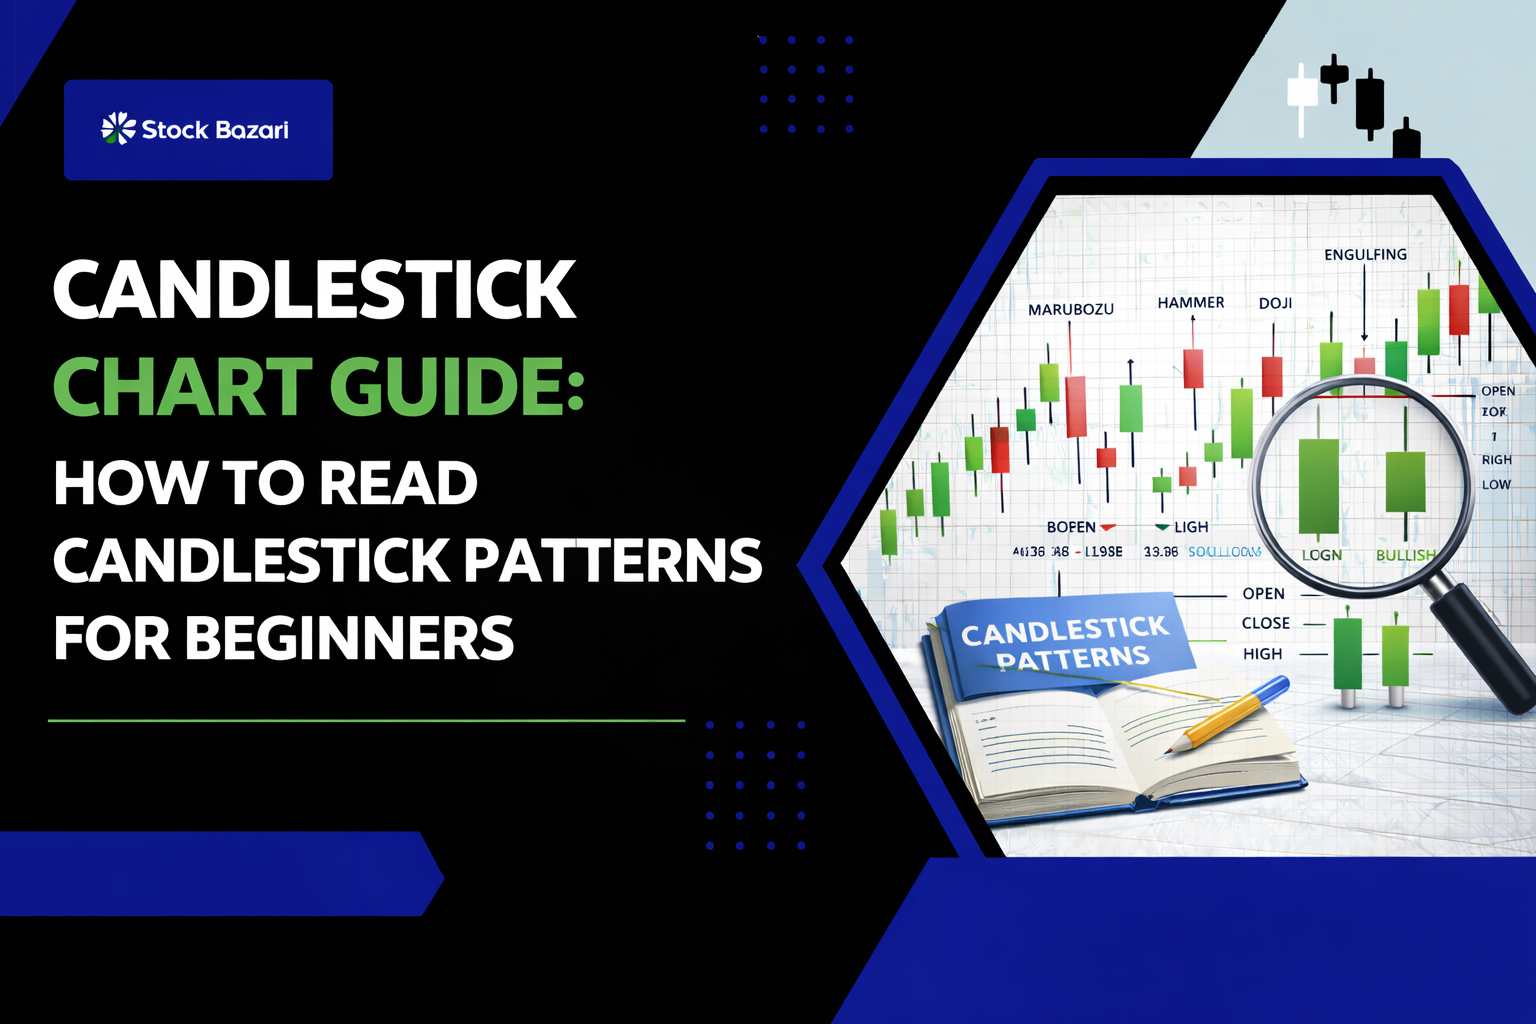
Candlestick Chart Guide for Beginners
Candlestick charts are one of the most popular tools used by traders in the stock market. They help traders understand price movements and market trends in a simple visual way.
Many traders in India use candlestick charts when analyzing stocks or indices before making trading decisions.
If you are new to trading, learning how candlestick charts work can help you understand market behavior more clearly.
This beginner guide explains the basics of candlestick charts and how traders use them in technical analysis.
What is a Candlestick Chart?
A candlestick chart is a type of stock price chart that shows how a stock’s price moves during a specific period.
Each candlestick represents four important price points:
- Opening price
- Closing price
- Highest price
- Lowest price
These price points help traders understand whether the market is bullish (rising) or bearish (falling).
Candlestick charts are widely used in technical analysis because they provide detailed information about market sentiment.
Parts of a Candlestick
Each candlestick has three main components.
Body
The body represents the difference between the opening price and the closing price.
If the closing price is higher than the opening price, the candlestick is usually shown as green or white, indicating a bullish move.
If the closing price is lower than the opening price, the candlestick is usually red or black, indicating a bearish move.
Upper Shadow
The upper shadow shows the highest price reached during the trading period.
It indicates how high the price went before falling back toward the closing price.
Lower Shadow
The lower shadow shows the lowest price reached during the trading period.
It indicates how low the price dropped before recovering.
Understanding these parts helps traders read market signals more effectively.
Common Candlestick Patterns
There are many candlestick patterns that traders watch for when analyzing charts.
Doji Pattern
The Doji pattern appears when the opening and closing prices are almost equal.
This pattern often indicates market indecision.
Traders may expect a possible trend change after a Doji pattern.
Hammer Pattern
The Hammer pattern appears after a price decline and may signal a potential reversal.
It has a small body and a long lower shadow.
This pattern suggests that buyers are starting to enter the market.
Bullish Engulfing Pattern
This pattern occurs when a large bullish candle completely covers the previous bearish candle.
It may signal the start of an upward trend.
Many traders consider it a strong bullish signal.
Example of Candlestick Analysis
Suppose a stock has been falling for several days.
A Hammer pattern appears near a support level.
Traders may interpret this as a sign that selling pressure is decreasing and buyers are entering the market.
Based on this signal, traders may consider entering a buy position.
However, traders usually combine candlestick patterns with other technical indicators for better confirmation.
Why Candlestick Charts Are Important for Traders
Candlestick charts are widely used because they provide clear insights into market behavior.
They help traders:
- Identify market trends
- Understand buyer and seller strength
- Find entry and exit points
- Analyze price momentum
Because of these advantages, candlestick charts are commonly used in both intraday trading and swing trading.
Tips for Beginners Using Candlestick Charts
If you are new to candlestick analysis, keep these tips in mind.
- Focus on learning basic candlestick patterns
- Combine candlestick patterns with support and resistance levels
- Avoid making decisions based on a single candlestick
- Practice chart reading regularly
- Keep learning technical analysis concepts
With time and experience, reading candlestick charts becomes easier.
Conclusion
Candlestick charts are one of the most useful tools in technical analysis. They help traders visualize price movements and identify potential trading opportunities.
For beginners in the Indian stock market, learning candlestick patterns is an important step toward understanding market trends and improving trading decisions.
By practicing chart analysis and combining candlestick signals with other indicators, traders can develop better strategies and manage risk more effectively.