

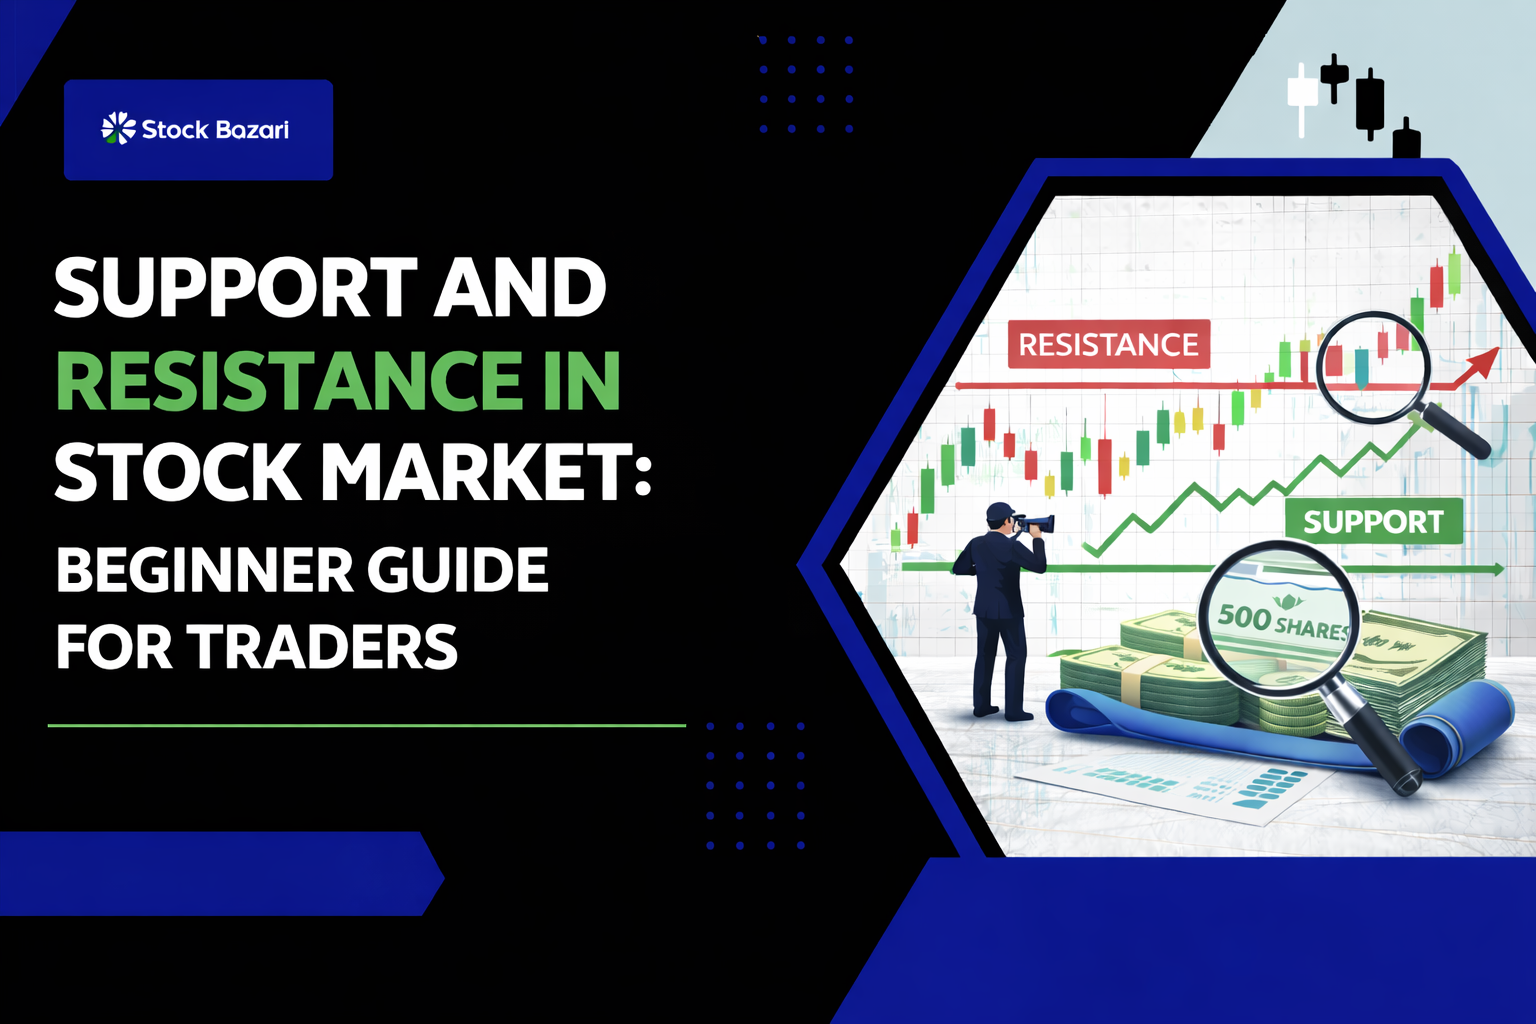
Support and Resistance in the Stock Market
Support and resistance are two of the most important concepts in technical analysis. Many traders in the Indian stock market use these levels to understand where prices may stop or reverse.
Whether someone trades stocks, indices, or derivatives, understanding support and resistance helps in making better trading decisions.
For beginners, these levels provide a simple way to analyze market behavior and identify possible entry and exit points.
What is Support in Trading?
Support is a price level where a stock tends to stop falling and may start rising again.
This happens because many buyers enter the market at that level, creating buying pressure.
For example, suppose a stock repeatedly falls to ₹500 and then rises again.
In this case, ₹500 becomes a support level.
Traders often look for buying opportunities near support because prices may bounce upward.
What is Resistance in Trading?
Resistance is the opposite of support.
It is a price level where a stock often stops rising and may start falling.
This happens because many traders start selling their shares at that level.
For example, if a stock rises several times to ₹600 but fails to move higher, ₹600 becomes a resistance level.
Traders may consider selling near resistance levels.
Why Support and Resistance Are Important
Support and resistance help traders understand market psychology.
They indicate areas where buyers or sellers are likely to become active.
These levels help traders:
- Identify potential entry points
- Find profit-booking levels
- Manage risk using stop-loss orders
- Understand market trends
Because of this, support and resistance are widely used in both intraday trading and swing trading.
How to Identify Support and Resistance
There are several ways traders identify these levels.
Using Historical Price Levels
One of the simplest methods is analyzing previous price movements.
If a stock repeatedly reverses at the same price level, it often becomes a support or resistance level.
Historical levels are widely used by traders.
Using Trendlines
Trendlines are lines drawn on a chart that connect important price points.
An upward trendline may act as support, while a downward trendline may act as resistance.
Trendlines help traders understand the direction of the market.
Using Moving Averages
Some traders use moving averages to identify dynamic support and resistance levels.
For example, a stock price may repeatedly bounce from its 50-day moving average, which then acts as support.
This method is commonly used in technical analysis.
Example of Support and Resistance
Suppose a stock is trading between ₹900 and ₹1000.
Whenever the price drops to ₹900, buyers enter the market and the price rises again.
Whenever the price reaches ₹1000, sellers start selling and the price falls.
In this situation:
₹900 acts as support
₹1000 acts as resistance
Traders may buy near support and sell near resistance.
However, if the price breaks above resistance, it may continue rising further.
Common Mistakes Beginners Make
Many beginners misuse support and resistance levels.
Some common mistakes include:
- Ignoring market trends
- Placing trades exactly at support or resistance without confirmation
- Using too many indicators
- Not using stop-loss
Understanding these mistakes can help traders improve their strategies.
Tips for Beginners Using Support and Resistance
If you want to use support and resistance effectively, follow these tips.
- Use higher-timeframe charts to identify strong levels
- Combine support and resistance with candlestick patterns
- Wait for confirmation before entering a trade
- Always use stop-loss to manage risk
- Practice analyzing charts regularly
With experience, traders become better at identifying these levels.
Conclusion
Support and resistance are essential concepts in technical analysis. They help traders identify key price levels where the market may change direction.
By learning how to identify these levels, beginners can improve their trading decisions and manage risk more effectively.
For traders in the Indian stock market, understanding support and resistance is an important step toward building a strong trading strategy.